
Challenge
NGP VAN's acquisition of DonorTrends handed us a powerful predictive analytics engine tied to a white-glove consulting model that couldn't scale. When COVID hit, fundraisers needed accessible tools right inside the CRM they already used, not weeks of consultation. Our job was to turn a consulting engagement into a self-serve product without losing what made DonorTrends' insights valuable.
Approach
I brought the DonorTrends team in as design partners from day one, running a workshop to frame How Might We statements before opening Figma. From there, I iterated through wireframes and usability sessions with fundraisers from seven organizations to land on a scannable single-page pattern.
Before
Onboarding (below): Even after buying DonorTrends, getting up and running took a while. Spinning up an instance took the small team about a week, training ran three hours, and monthly user groups tried to help fundraisers make sense of the predictive scores. Momentum died before anyone opened the tool.
Before
Onboarding
1.Purchase DonorTrends
Complete the purchase and contract signing
2.Wait
Wait days or weeks for access and onboarding scheduling
3.Schedule training
Coordinate calendars for multi-hour training sessions
4.Attend group trainings
Join monthly user groups to decode predictive scores and their applications
5.Ongoing support
Continuously reach out for help understanding features
After
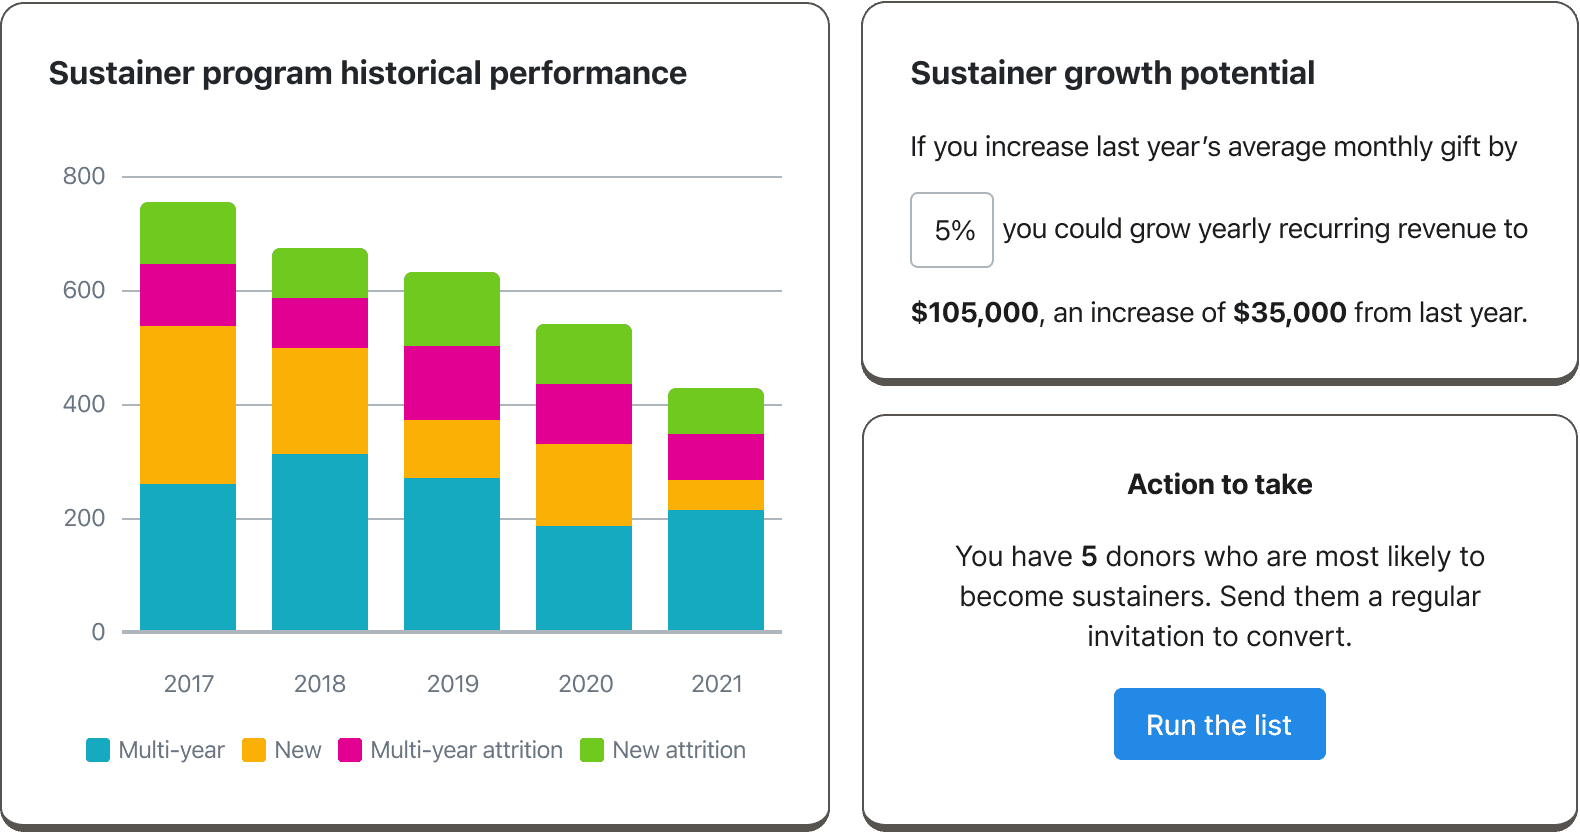
Fundraising Optimization Guide (below): An interactive, self-serve guide inside NGP VAN. Fundraisers open it and see ROI-ranked strategies drawn from their own donor data. Predictive scores also show up across the CRM so intelligence surfaces where the work already happens.
Impact
- 2-3 weeks → Instant
- Time to value
- 70% in 6 months
- DonorTrends Classic migration
- 65% in 90 days
- Sustainer model adoption
More projects


Connect
Need help building experiences that deliver a resounding ‘wow’? Let’s talk.
Copyright © 2026 flor de nopal